Military Health
Lead Data Scientist · Pivot Path Solutions
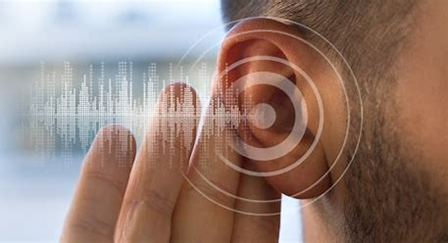
Advanced Epidemiological Analysis of Military Hearing Loss
Built a ~200-million-record health data platform spanning 15 military and commercial systems, then modeled who is at risk of hearing loss and who recovers — for the Defense Health Agency.
Military HealthPublic HealthData EngineeringPredictive ModelingReal World Data (RWD)Reproducible ResearchEHR & ClaimsAudiometric DataAdministrative RecordsPythonSQLSnowflakeJupyter
Hearing loss is the most prevalent service-connected disability in the U.S. military — the Veterans Benefits Administration reports that 76% of veterans experience hearing loss, tinnitus, or both. Treatment options for chronic sensorineural hearing loss (SNHL) are limited, which puts almost all of the leverage on early identification of risk. The Defense Health Agency funded this project to answer two questions: who is most likely to develop moderate-to-severe SNHL, and among those who do, who recovers.
The data problem
Eight military health systems and nine commercial real-world data sources arrived with no common structure — audiometric test records, outpatient and inpatient encounters, personnel and occupational codes, pharmacy transactions, vital signs, medical claims, and EMR lab results. Roughly 200 million records in total, covering 2.33 million active-duty Service members and 40,000 civilian patients across 2018–2023. The focal dataset alone held 17.1 million audiometric records across 57 columns, delivered as sixteen branch-stratified multipart compressed archives.
What I built
I designed and implemented a Bronze/Silver/Gold medallion lakehouse in Snowflake. The Bronze layer ingested raw files with fault-tolerant staged loads and automated row-count and null-rate validation. The Silver layer applied the quality rules — a field advanced only if it passed clinical subject-matter-expert review and had under 80% nulls — plus cross-system reconciliation of contradictory age and sex records under explicit precedence rules, yielding a validated active-duty analytic sample of 1.74 million individuals. The Gold layer produced a single row per patient with 173 derived variables.
Two source systems were excluded after I documented reporting inconsistencies and insufficient patient linkage. Knowing when to cut a dataset is part of the job.
Feature engineering
The source data contained almost none of the variables the research question needed, so they had to be constructed:
- Audiogram morphology — a rule-based classifier sorting hearing-test curves into six shapes (flat, tent, cookie bite, slope, reverse slope, corner) from thresholds across frequencies.
- Hearing protection taxonomies — binary indicators for over-ear versus in-ear, custom-molded versus standard, and active versus passive devices, derived from free-form equipment fields against standardized public definitions.
- Occupational communities — a hierarchical matching cascade (exact → prefix → substring, with low-confidence matches flagged for exclusion) mapping four services’ mutually incompatible occupational coding systems onto one taxonomy, validated with military health subject-matter experts.
- 35+ ICD-derived condition flags, aggregated from code sets by clinical SMEs.
Modeling
Risk factors were modeled with a two-stage logistic regression framework: univariable screening across 101 candidate predictors, then branch-stratified covariate-adjusted models. The analysis identified sex, rank, occupational community, audiogram morphology, and hearing protection type as independently associated with severity — combat and construction communities carrying the highest risk, sloping audiograms the strongest audiometric correlate.
The most interesting result was counterintuitive: heavier over-ear protection was associated with worse outcomes than in-ear protection, even after adjustment. Read as a device-efficacy finding, that makes no sense. Read as an exposure-assignment effect — the people issued the heaviest protection are the ones in the loudest jobs — it makes complete sense, and it changed the recommendation we gave the sponsor: model protective equipment as a device-by-exposure interaction, not as a standalone risk factor.
On the civilian side, obesity and several lipid conditions looked like clear risk factors until adjustment, at which point they vanished entirely. The signal was age confounding. Flagging that kept a spurious clinical conclusion out of the final report.
Recovery was modeled as a 112-model grid crossing clinical feature sets, recovery definitions, severity classes, and service branches, evaluated with precision-recall AUC rather than ROC because recovery is a rare outcome and ROC flatters models that cannot actually classify it. Objective audiometric measurements contributed the largest incremental predictive gain across all four branches. The models fit significantly but classified few true positives — reported transparently, with a diagnosis of the causes and a recommendation for non-linear methods and finer temporal resolution.
Reproducibility
The pipeline is nine numbered Python stages under version control, with automated regression testing that compares model coefficients across pipeline versions so reported results stay reproducible as the code changes. Shared classification logic was consolidated into one vectorized utility module, and legacy R-derived variables were ported into the single pipeline to close cross-language gaps.
Delivery
All 14 of 14 contract deliverables went out on or ahead of schedule across an 18-month period of performance. I also documented a data-request process improvement — using the prerequisite checklist rather than a full data sharing agreement application for de-identified requests — that cut government approval time from six-plus weeks to about seven business days, preventing a schedule slip. Findings were briefed to DHA stakeholders and across three sessions of the State of the Science Symposium in Health Services Research in the Military Health System.
MTEC Award No. MTEC-24-01-MPAI-017, sponsored by the Defense Health Agency. Specific effect estimates are omitted here; the technical report carries a limited distribution statement.